This article changes how the markers and their numbers look, and shows how they follow themes and facets. For the basics, see Get started.
Styling the markers
The markers use the standard colour, fill, shape, size, stroke and alpha aesthetics, so they work with the usual ggplot2 scales. Here the most efficient car of each cylinder class is filled by class.
cars$best <- cars$mpg == ave(cars$mpg, cars$cyl, FUN = max)

ggplot(cars, aes(wt, mpg)) +
  geom_point(colour = "grey60") +
  geom_focus(
    aes(label = rank, focus = best, info = model, fill = factor(cyl)),
    shape = 22,
    size = 7
  ) +
  scale_fill_brewer("Cylinders", palette = "Set2") +
  scale_info_discrete("Best in class") +
  theme_minimal()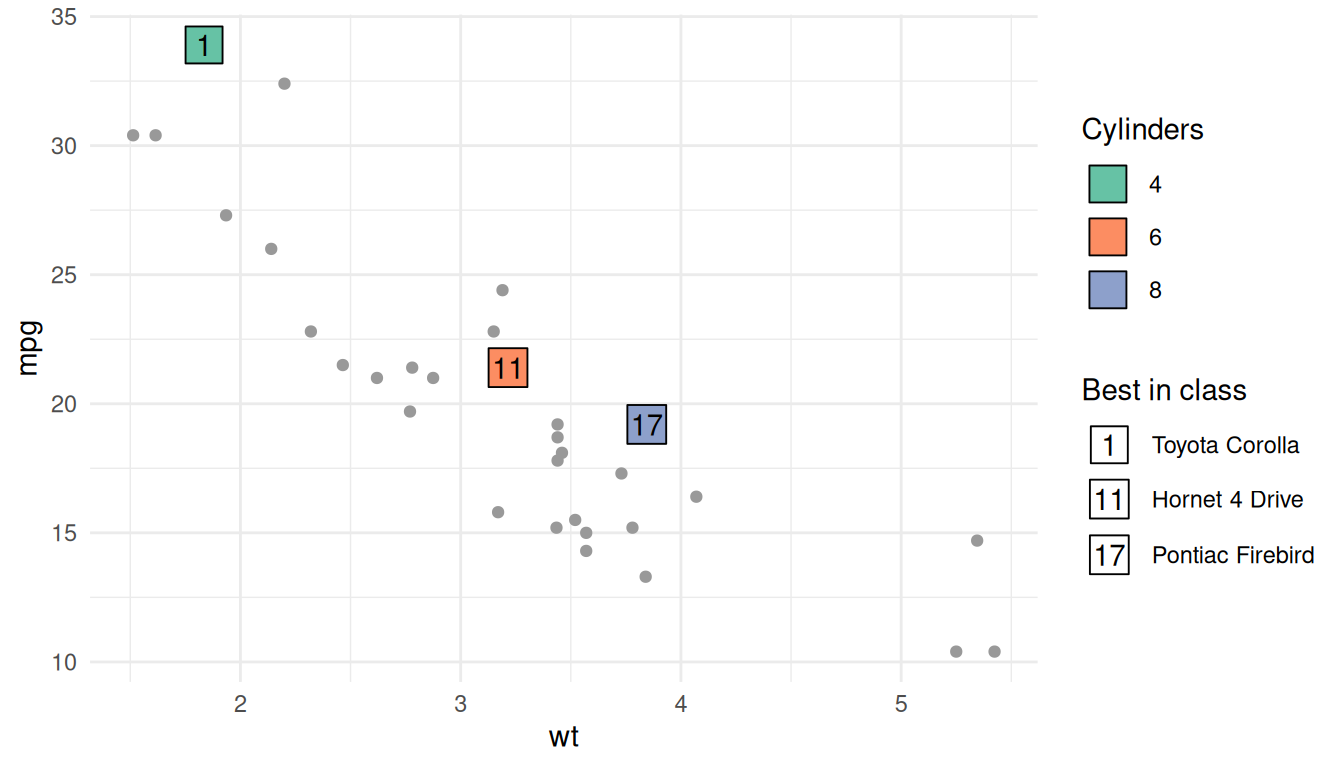
Styling the numbers
The numbers take the family and fontface aesthetics and the text.colour and text.size parameters. By default they use the marker’s colour. The legend keys show the same style.
ggplot(cars, aes(wt, mpg)) +
  geom_point(colour = "grey60") +
  geom_focus(
    aes(label = rank, focus = rank <= 5, info = model),
    fill = "grey20",
    text.colour = "white",
    fontface = "bold"
  ) +
  theme_minimal()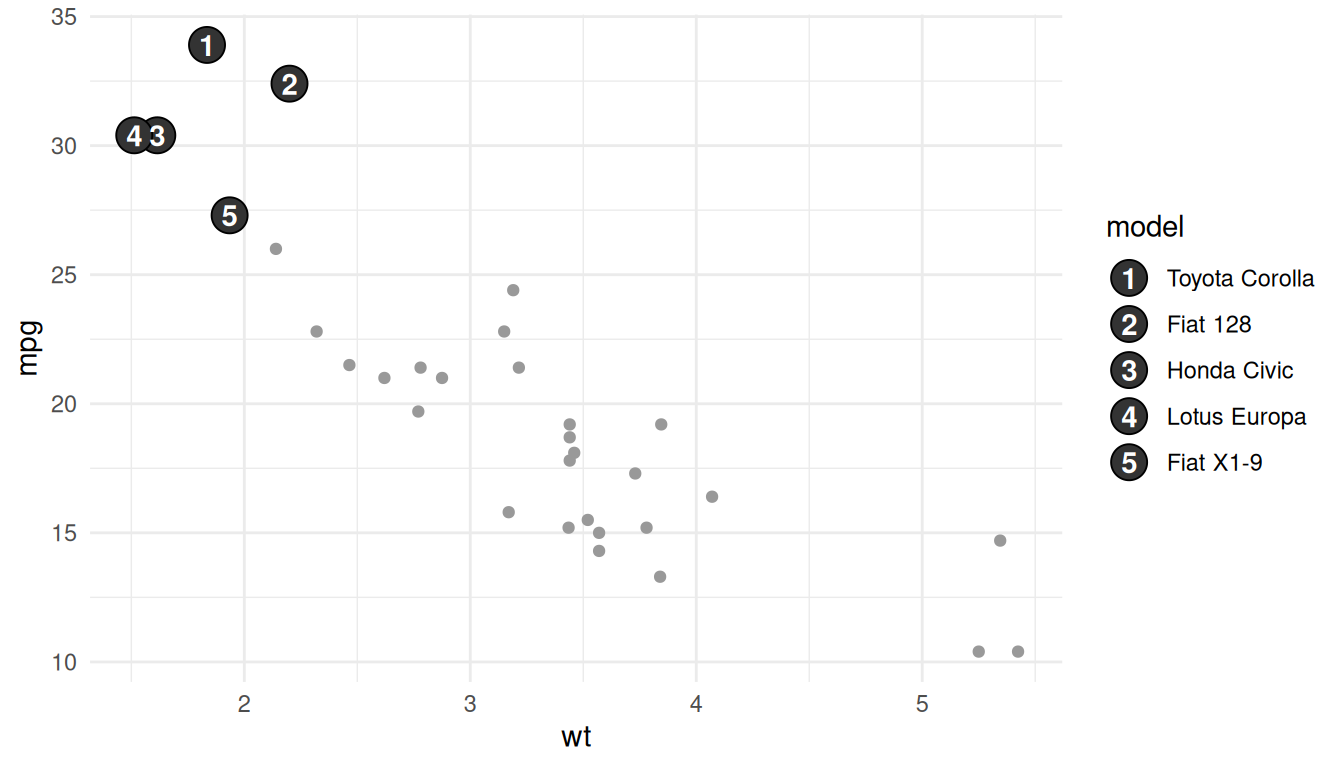
Themes
Without other settings, markers are filled with the theme’s paper colour and drawn with its ink colour, so they follow the theme.
ggplot(cars, aes(wt, mpg)) +
  geom_point(colour = "grey50") +
  geom_focus(aes(label = rank, focus = rank <= 5, info = model)) +
  theme_minimal(ink = "white", paper = "grey15")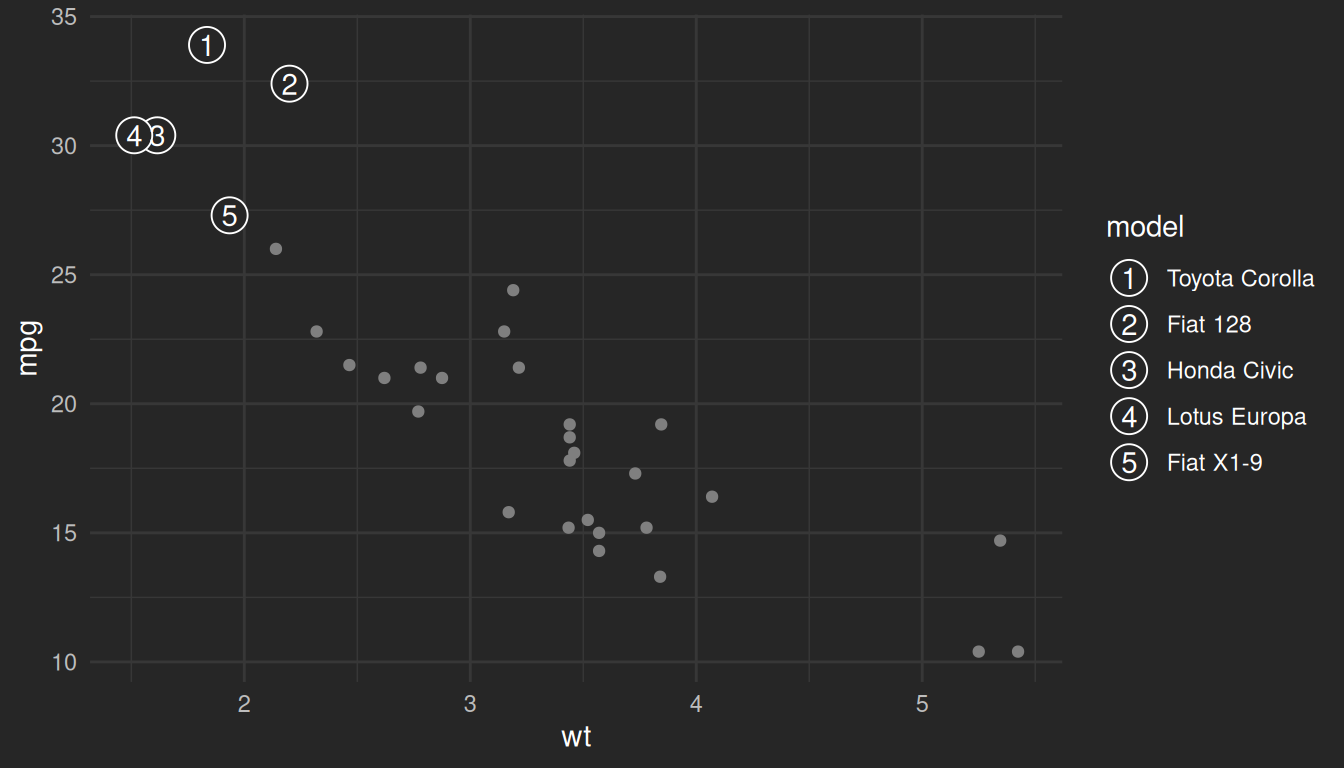
Facets
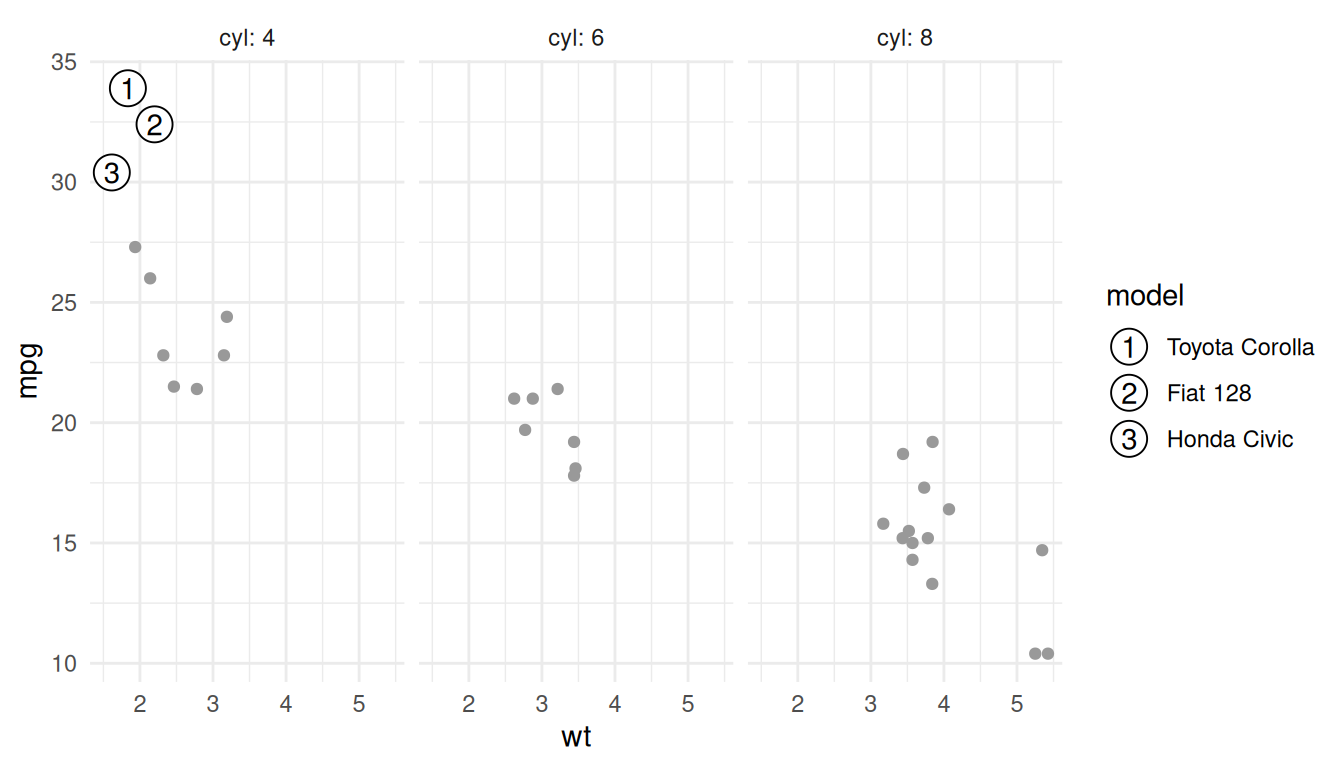
Focus points are drawn in the panel they fall in, and a panel without focus points shows only the other layers. The three most efficient cars all have four cylinders.
ggplot(cars, aes(wt, mpg)) +
  geom_point(colour = "grey60") +
  geom_focus(aes(label = rank, focus = rank <= 3, info = model)) +
  facet_wrap(vars(cyl), labeller = label_both) +
  theme_minimal()