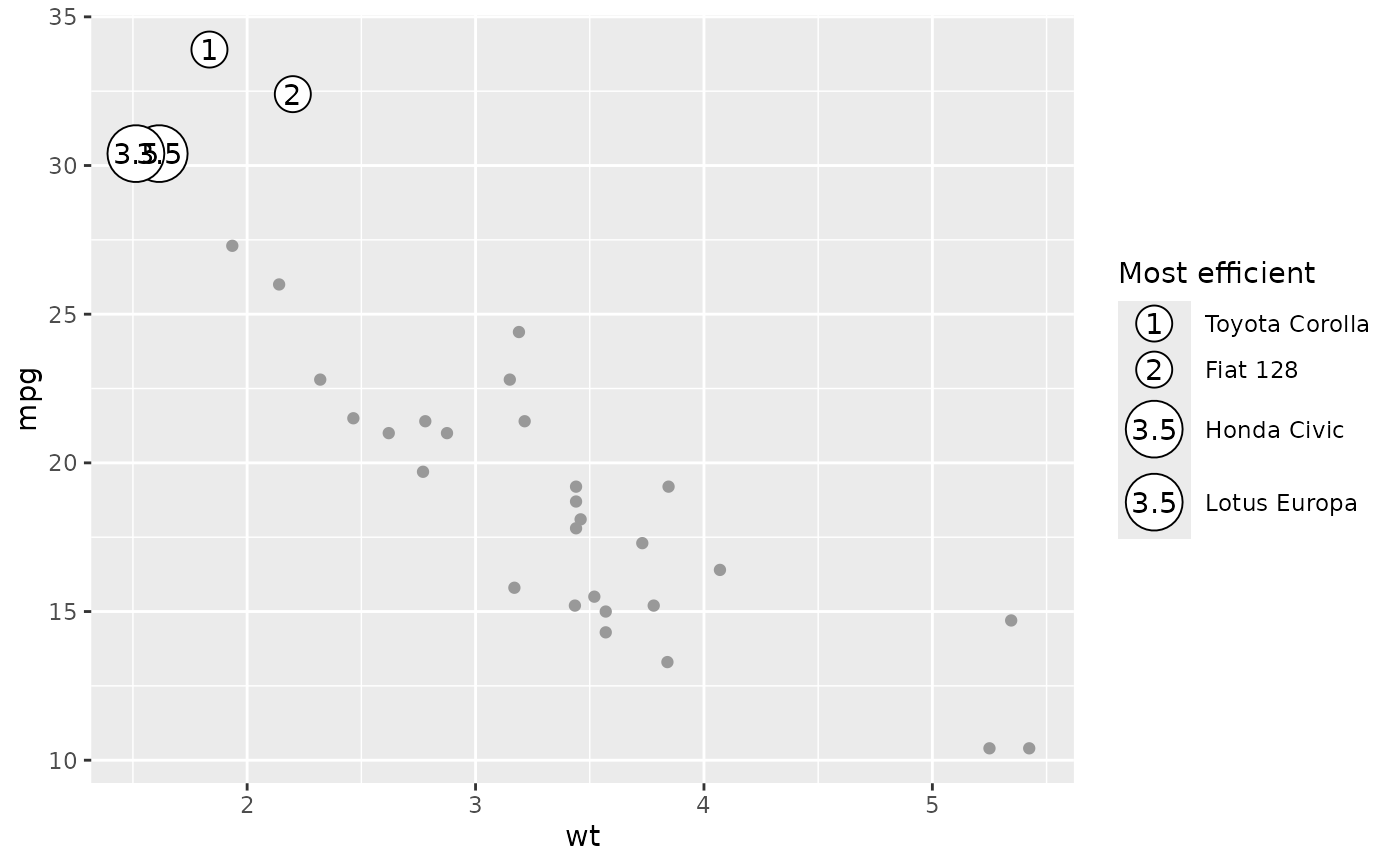
Builds the legend that lists the description of each numbered marker. It
is added automatically when info is mapped; call it directly to change the
legend title or other legend settings.
Usage
scale_info_discrete(name = ggplot2::waiver(), ..., guide = "legend")Arguments
- name
The name of the scale. Used as the axis or legend title. If
waiver(), the default, the name of the scale is taken from the first mapping used for that aesthetic. IfNULL, the legend title will be omitted.- ...
Other arguments passed on to
ggplot2::discrete_scale().- guide
A function used to create a guide or its name. See
guides()for more information.
Value
A ggplot2 scale object (class ScaleDiscreteIdentity, a
ggproto object). Add it to a plot with + to control the legend that
maps each info value to its numbered marker.
Examples
cars <- mtcars
cars$model <- rownames(cars)
library(ggplot2)
ggplot(cars, aes(wt, mpg)) +
  geom_point(colour = "grey60") +
  geom_focus(aes(label = rank(-mpg), focus = mpg > 30, info = model)) +
  scale_info_discrete(name = "Most efficient")