Maps and annotated figures often mark a few places with numbers and explain the numbers in a legend. ggplot2 has no direct way to draw this: a legend key shows a symbol, not the number that labels a point. geom_focus() draws the numbered markers and builds the legend for you.
Numbered points with a legend
Map info to the description that goes in the legend. The entries are numbered 1, 2, 3, … in the order they appear in the data.
sites <- data.frame(
  x = c(6, 7, 8, 9, 10),
  y = c(6, 9, 7, 10, 8),
  name = c("Library", "Main hall", "Sports centre", "Cafeteria", "Car park")
)

ggplot(sites, aes(x, y, info = name)) +
  geom_focus() +
  theme_minimal()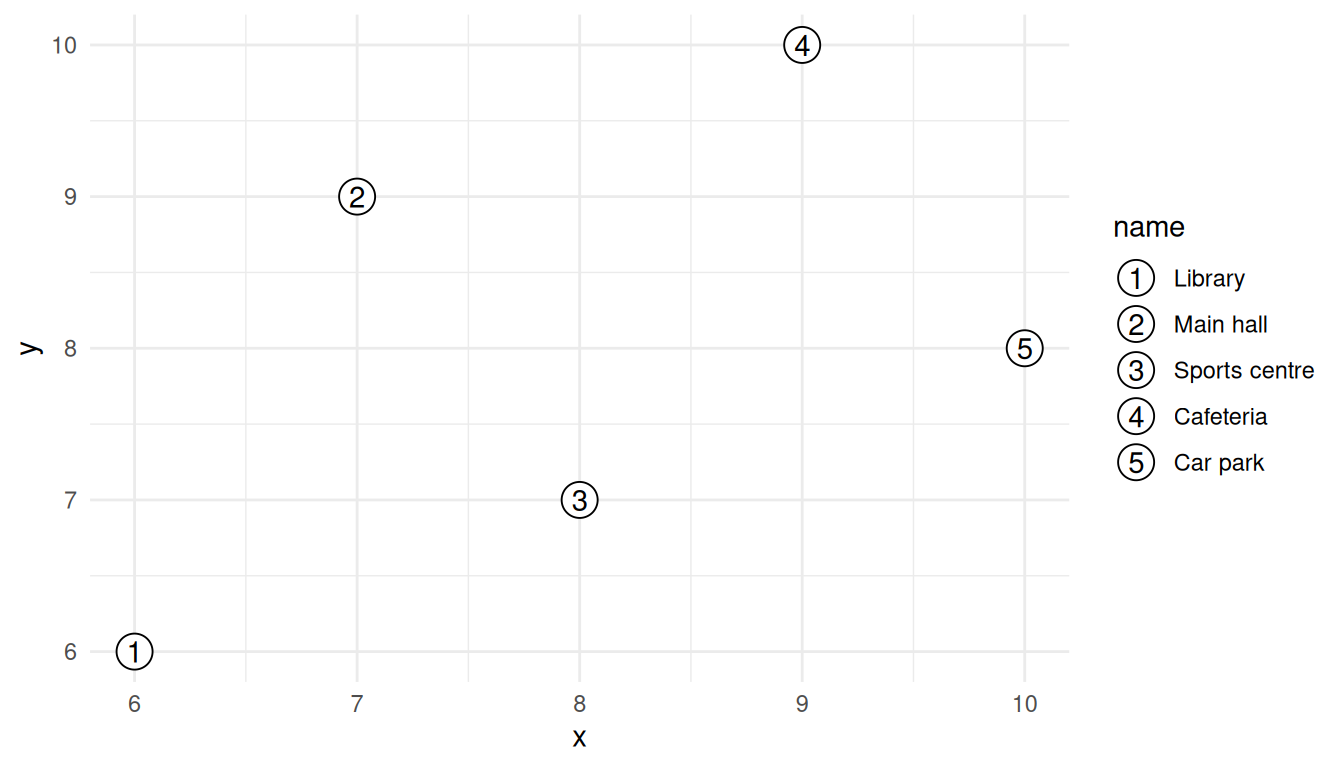
To choose the numbers yourself, map label. Legend entries are sorted by label, so the legend reads in the same order as the numbers. Markers grow to fit longer labels.
sites$code <- c(12, 3, 104, 7, 45)

ggplot(sites, aes(x, y, label = code, info = name)) +
  geom_focus() +
  theme_minimal()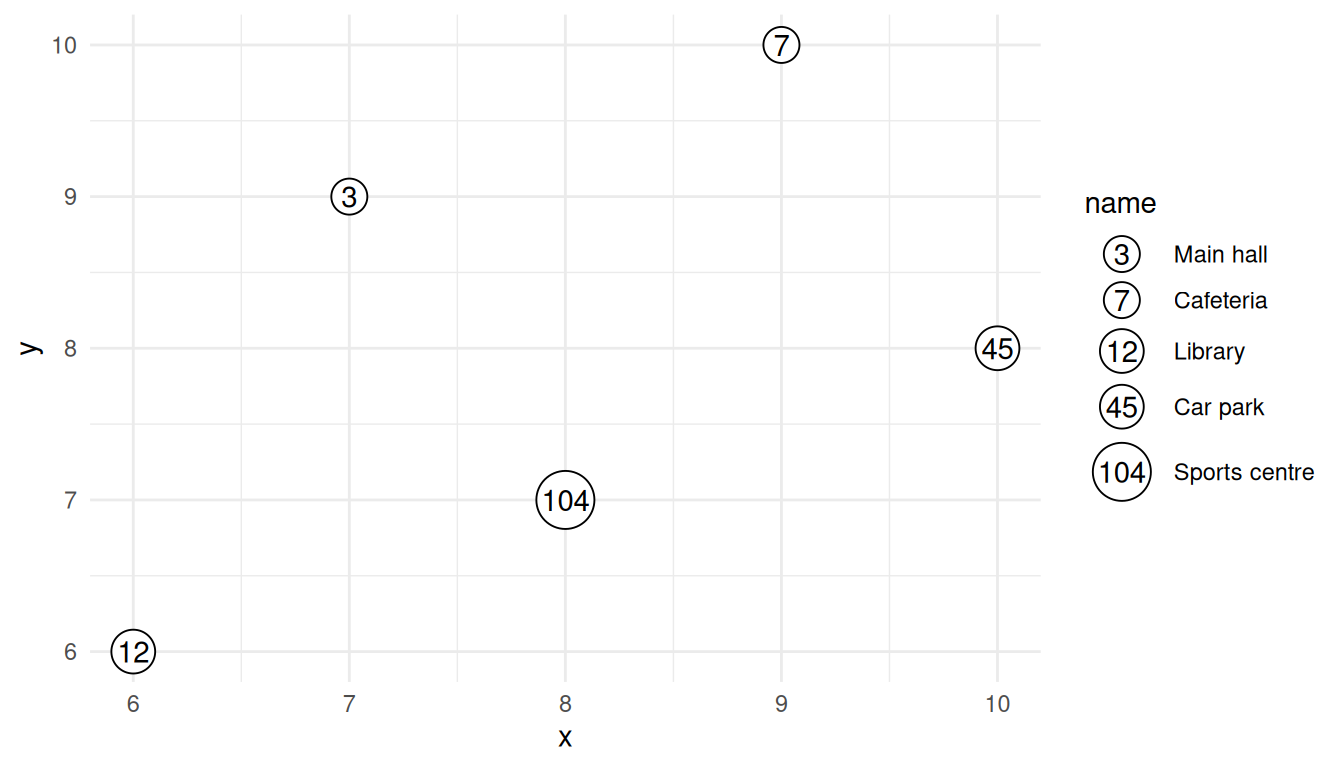
scale_info_discrete() is added automatically when info is mapped; call it yourself to set the legend title or other scale arguments.
Focus on a subset
Map focus to a logical variable to number only some observations. geom_focus() draws only the numbered markers, so add geom_point() to show the rest.
cars <- mtcars
cars$model <- rownames(cars)
cars$rank <- rank(-cars$mpg, ties.method = "first")

ggplot(cars, aes(wt, mpg)) +
  geom_point(colour = "grey60") +
  geom_focus(aes(label = rank, focus = rank <= 5, info = model)) +
  scale_info_discrete("Most efficient") +
  labs(x = "Weight (1000 lbs)", y = "Miles per gallon") +
  theme_minimal()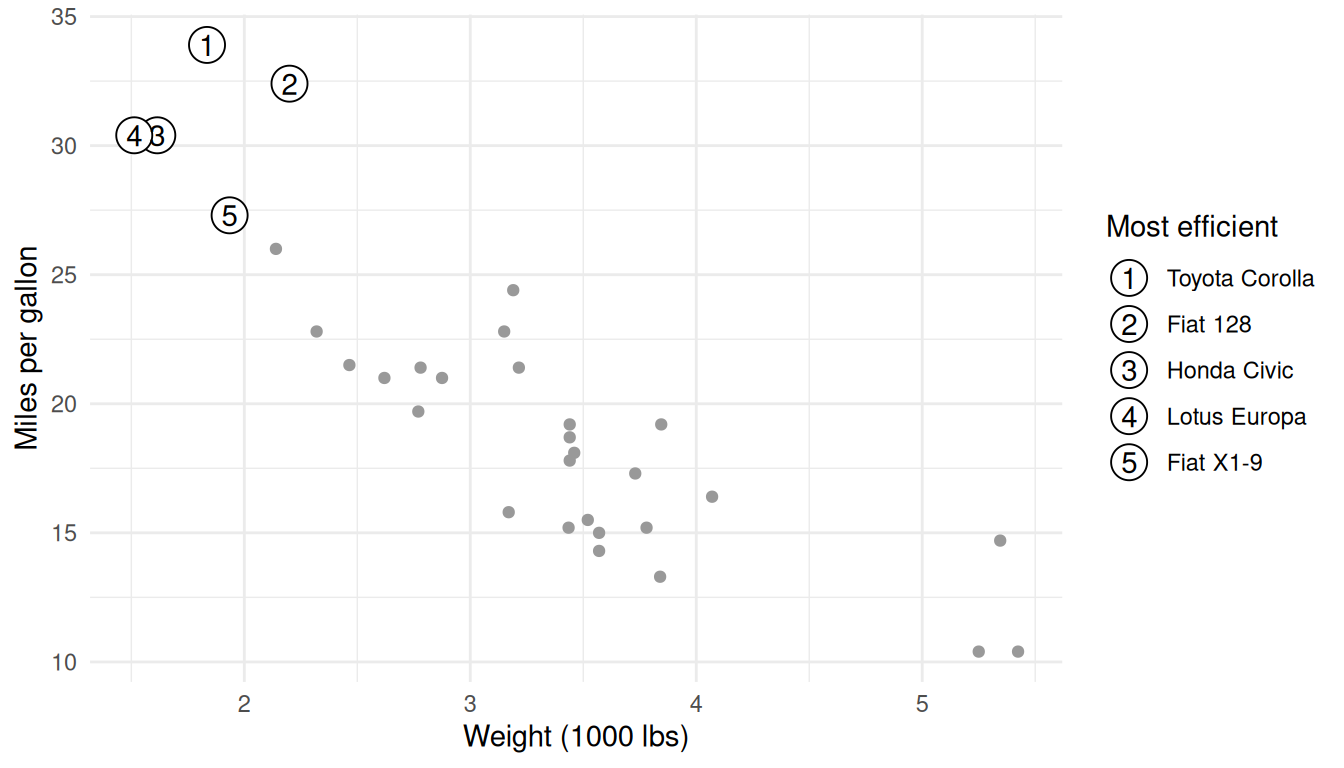
label, focus and info are mapped in geom_focus(), not in ggplot(). Layers inherit the mapping of ggplot(), so with info mapped there the geom_point() layer would add every car to the legend.
Overlapping markers
Markers are drawn at the data positions and don’t move apart, so points that nearly coincide, like 3 and 4 above, overlap. Map nudge_x or nudge_y and set position = "nudge" to move individual markers aside:
ggplot(cars, aes(wt, mpg)) +
  geom_point(colour = "grey60") +
  geom_focus(
    aes(
      label = rank,
      focus = rank <= 5,
      info = model,
      nudge_x = ifelse(model == "Lotus Europa", -0.12, 0)
    ),
    position = "nudge"
  ) +
  theme_minimal()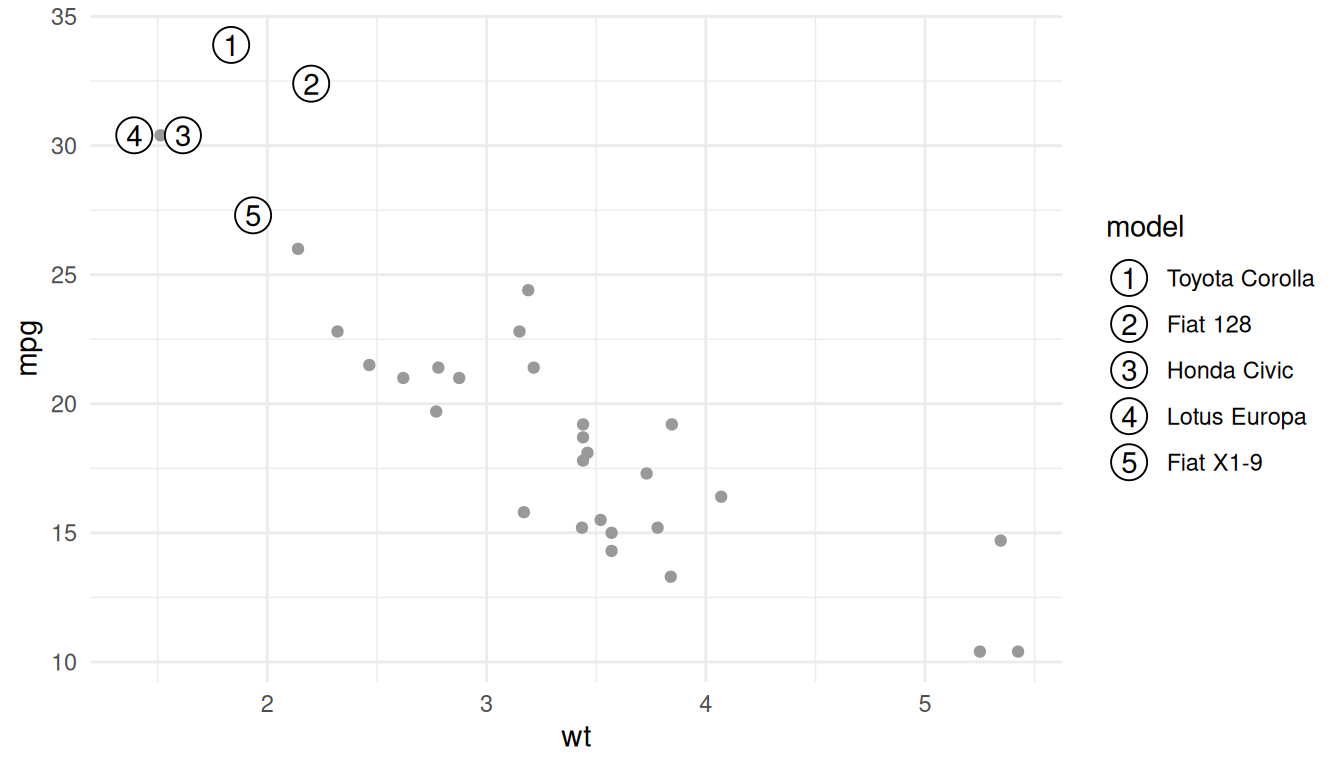
Maps
geom_sf_focus() numbers simple features from the sf package. Markers are placed on each feature with stat_sf_coordinates().
nc <- sf::st_read(system.file("shape/nc.shp", package = "sf"), quiet = TRUE)
nc <- sf::st_transform(nc, 32119)
nc_large <- nc[nc$AREA > 0.2, ]

ggplot(nc) +
  geom_sf(fill = "grey90", colour = "white") +
  geom_sf_focus(aes(info = NAME), data = nc_large) +
  scale_info_discrete("Largest counties") +
  theme_void()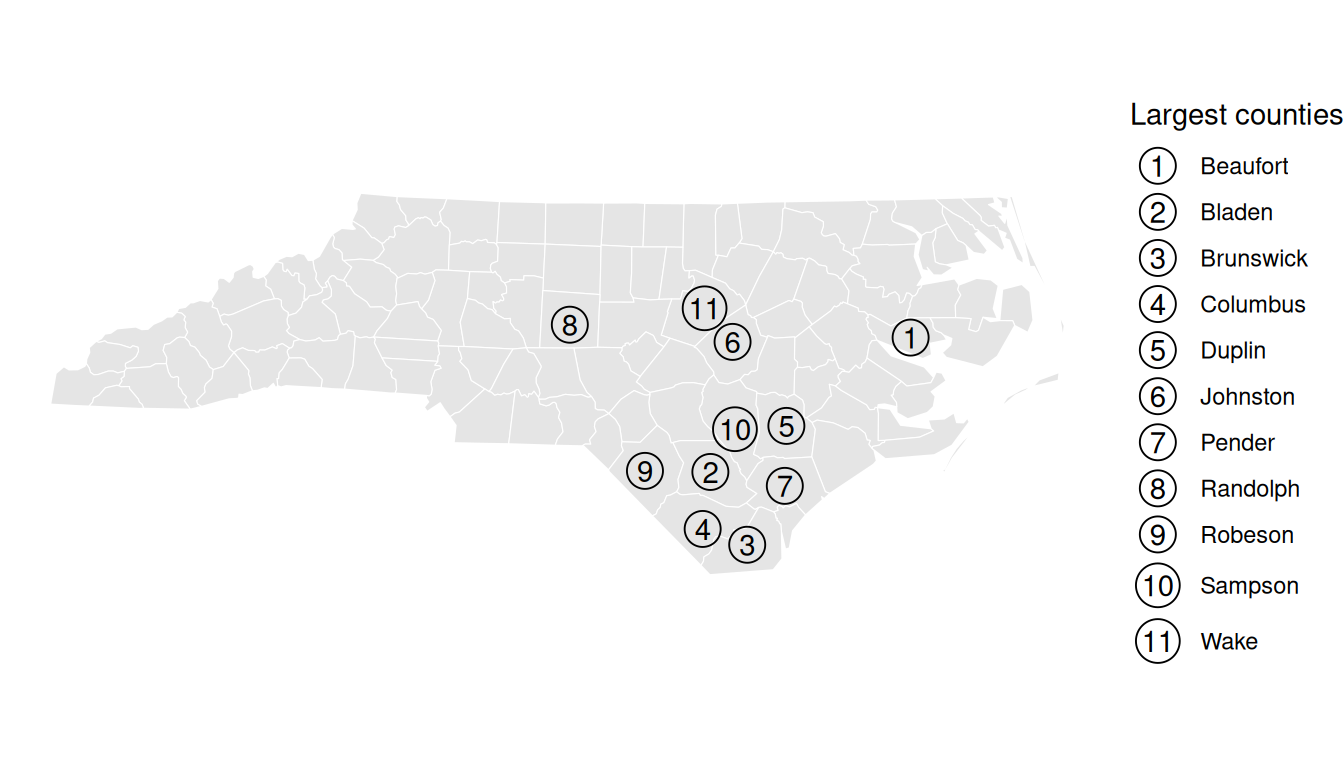
Styling the markers
The markers use the standard colour, fill, shape, size, stroke and alpha aesthetics, so they work with the usual ggplot2 scales. Here the most efficient car of each cylinder class is filled by class.
cars$best <- cars$mpg == ave(cars$mpg, cars$cyl, FUN = max)

ggplot(cars, aes(wt, mpg)) +
  geom_point(colour = "grey60") +
  geom_focus(
    aes(label = rank, focus = best, info = model, fill = factor(cyl)),
    shape = 22,
    size = 7
  ) +
  scale_fill_brewer("Cylinders", palette = "Set2") +
  scale_info_discrete("Best in class") +
  theme_minimal()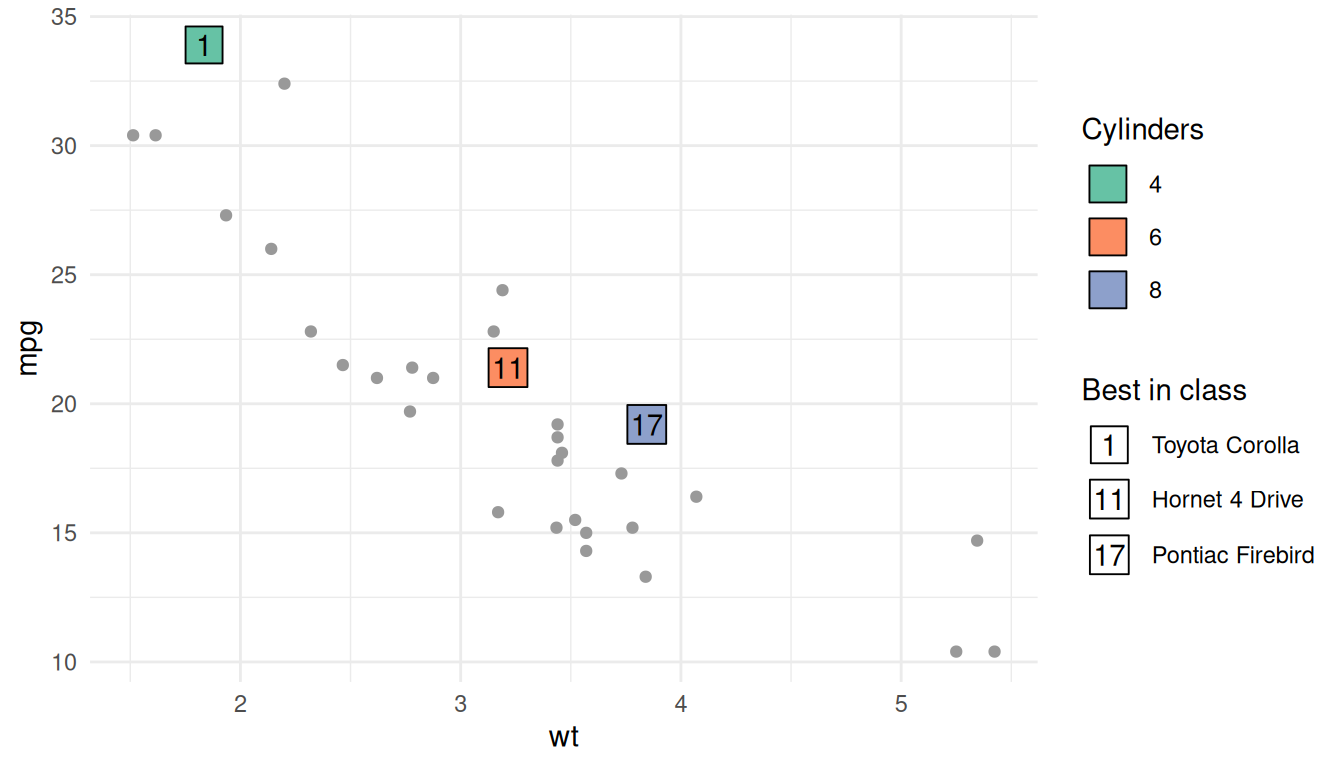
Styling the numbers
The numbers take the family and fontface aesthetics and the text.colour and text.size parameters. By default they use the marker’s colour.
ggplot(cars, aes(wt, mpg)) +
  geom_point(colour = "grey60") +
  geom_focus(
    aes(label = rank, focus = rank <= 5),
    fill = "grey20",
    text.colour = "white",
    fontface = "bold"
  ) +
  theme_minimal()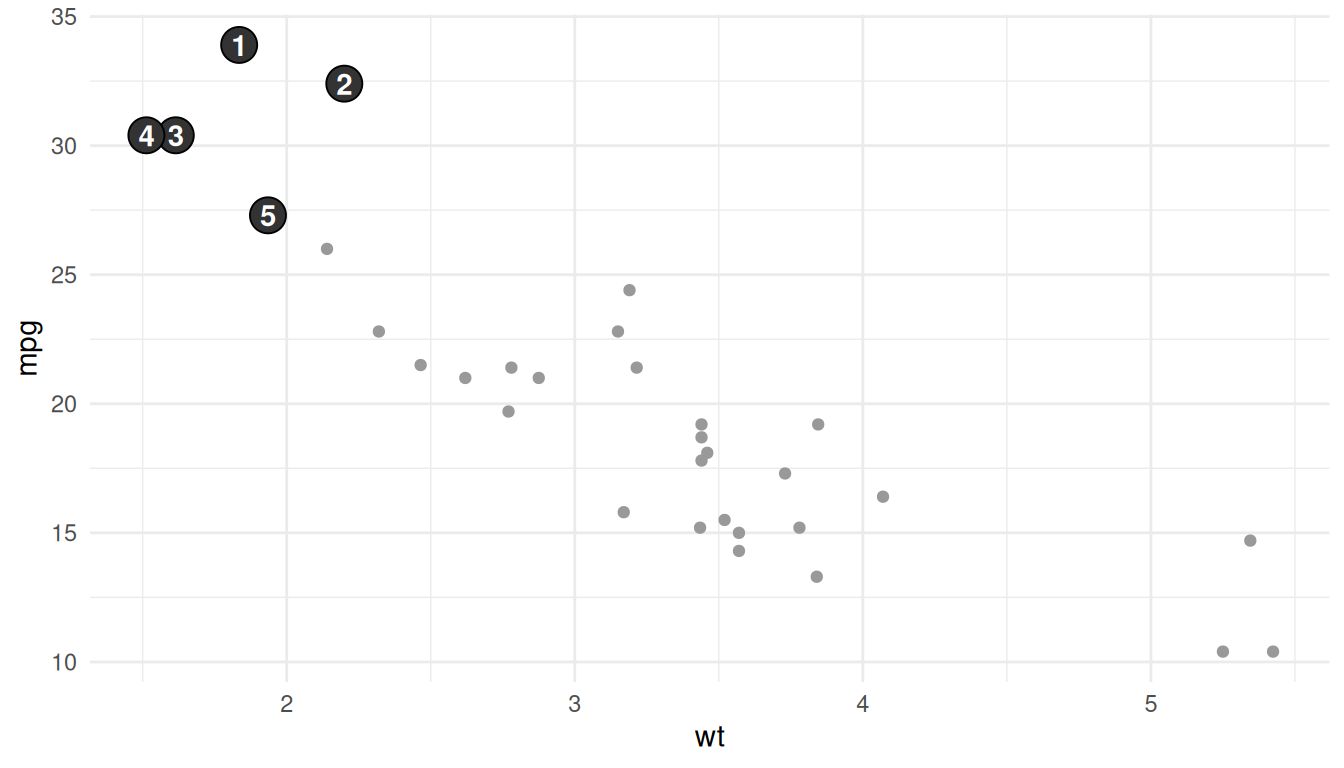
Themes
Without other settings, markers are filled with the theme’s paper colour and drawn with its ink colour, so they follow the theme.
ggplot(cars, aes(wt, mpg)) +
  geom_point(colour = "grey50") +
  geom_focus(aes(label = rank, focus = rank <= 5, info = model)) +
  theme_minimal(ink = "white", paper = "grey15")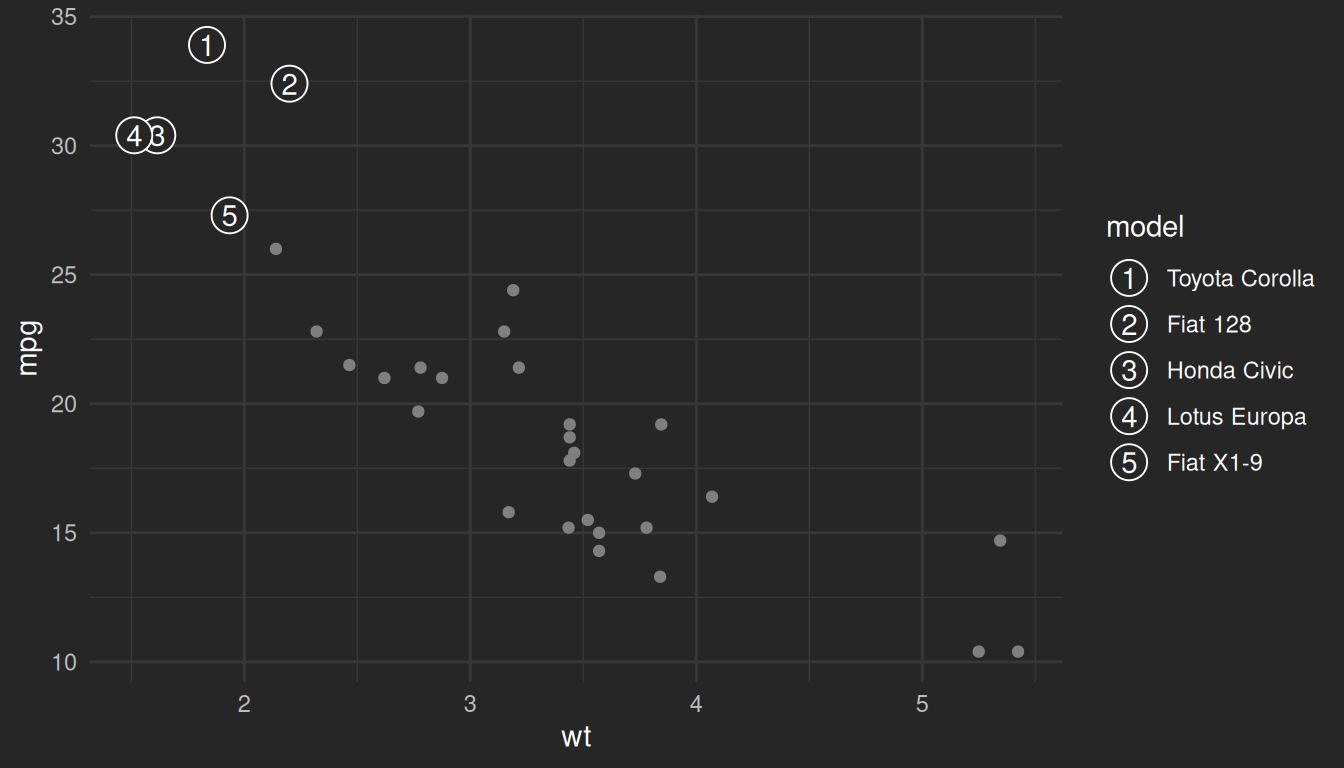
Facets
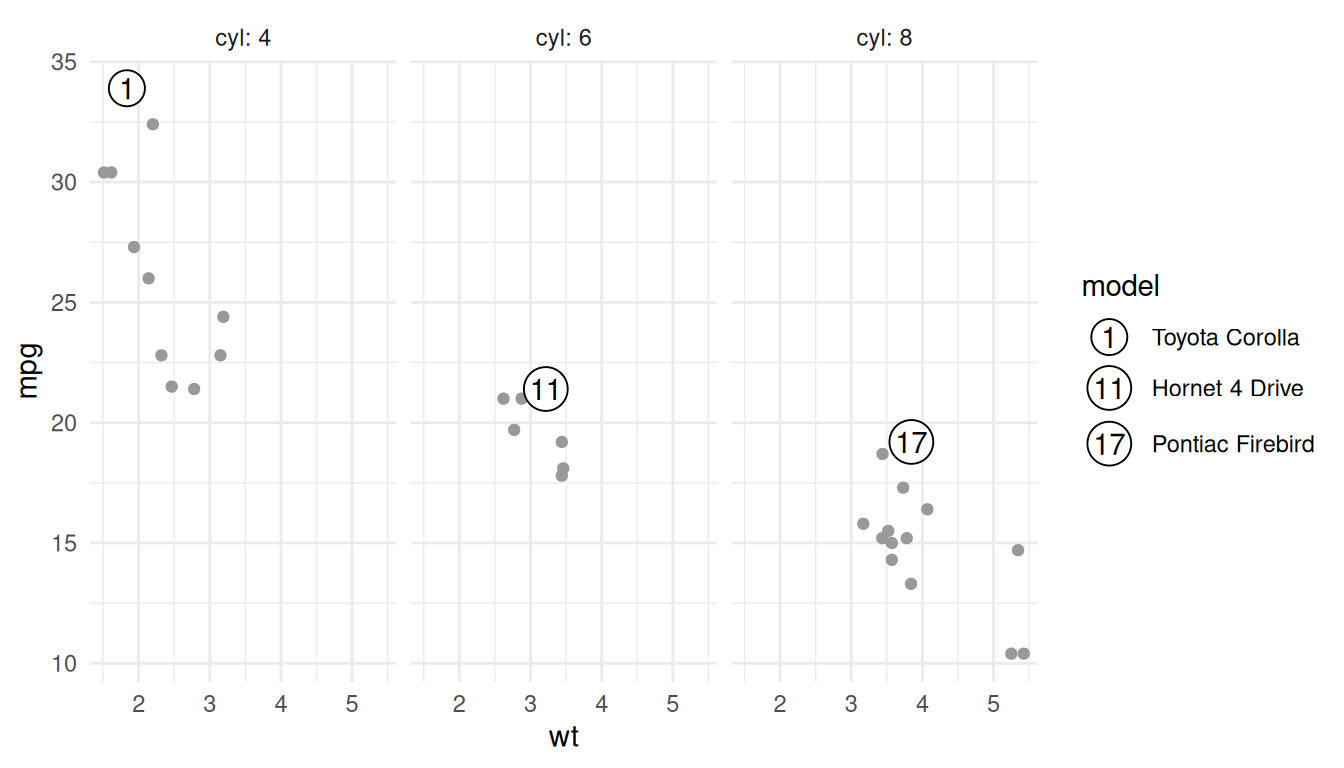
Each panel numbers its own focus points, and a panel without focus points shows only the other layers.
ggplot(cars, aes(wt, mpg)) +
  geom_point(colour = "grey60") +
  geom_focus(aes(label = rank, focus = best, info = model)) +
  facet_wrap(vars(cyl), labeller = label_both) +
  theme_minimal()