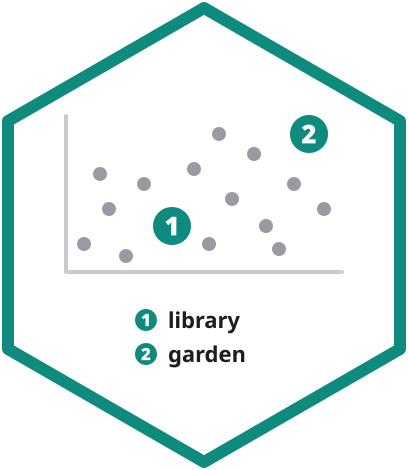
A campus map numbers its buildings and lists them in an index next to the map, so a reader can find the library or the sports centre at a glance.
This Stack Overflow question Adding index to points in ggplot shows such a map and asks how to draw the same kind of index in ggplot2, noting that there is no built-in way.
The accepted answer is a workaround.
The same problem comes up in other questions, all quite old: numbered point labels plus a legend in a scatterplot and ggplot2: numbered points on plot and in legend.
ggindex tries to solve this problem.
ggplot2 draws the numbers easily with geom_text() or geom_label(). The issue is to be able to draw the legend.
The examples below use the data from the question: five points, each with a number and a description.
df <- data.frame(x = 6:10, y = 6:10, id = 1:5)
df$label <- paste0("Label", df$id)
Numbers without a legend
geom_label() numbers the points, but nothing explains the numbers.
ggplot(df, aes(x, y)) +
  geom_point() +
  geom_label(aes(label = id), nudge_x = 0.2) +
  theme_minimal()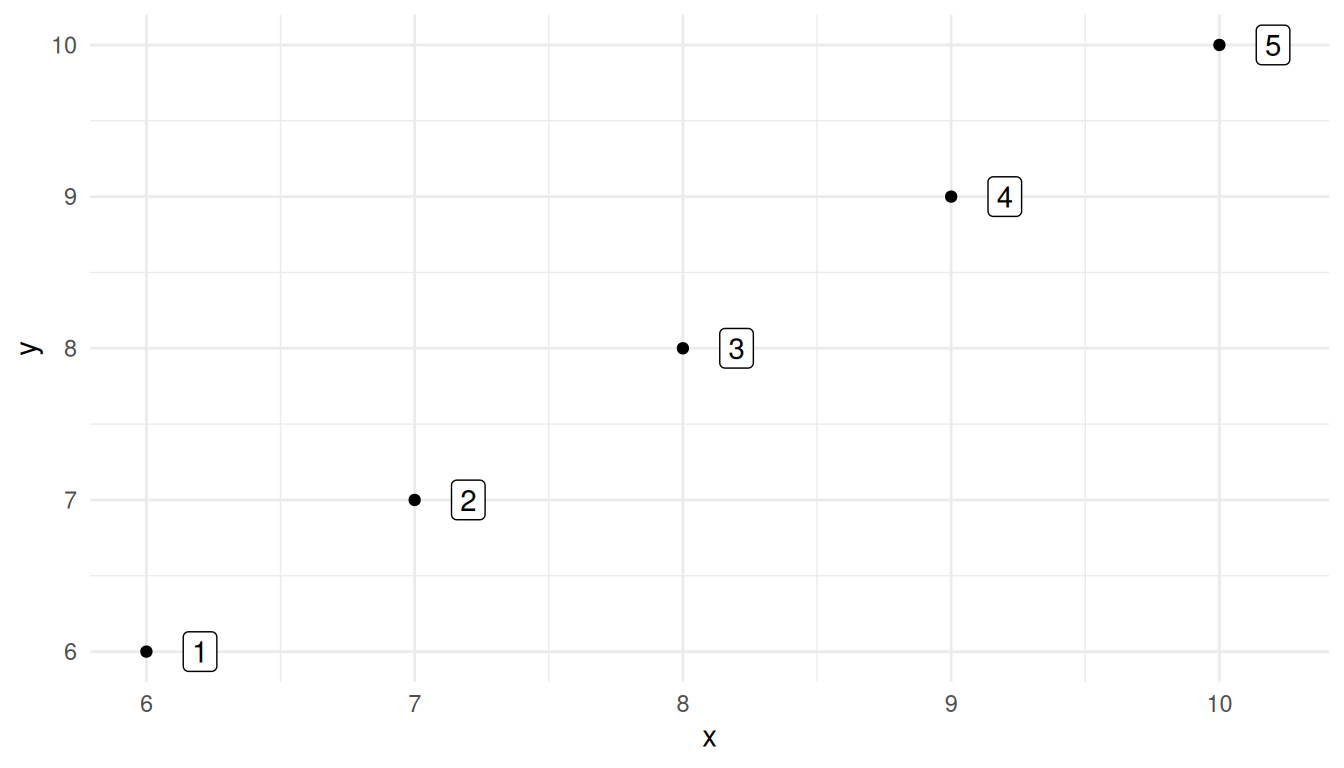
Mapping the description to another aesthetic, such as fill, adds a legend. Its keys show the point symbol, not the numbers, so the reader still can’t tell which point is which.
ggplot(df, aes(x, y)) +
  geom_point(aes(fill = label)) +
  geom_label(aes(label = id), nudge_x = 0.2) +
  theme_minimal()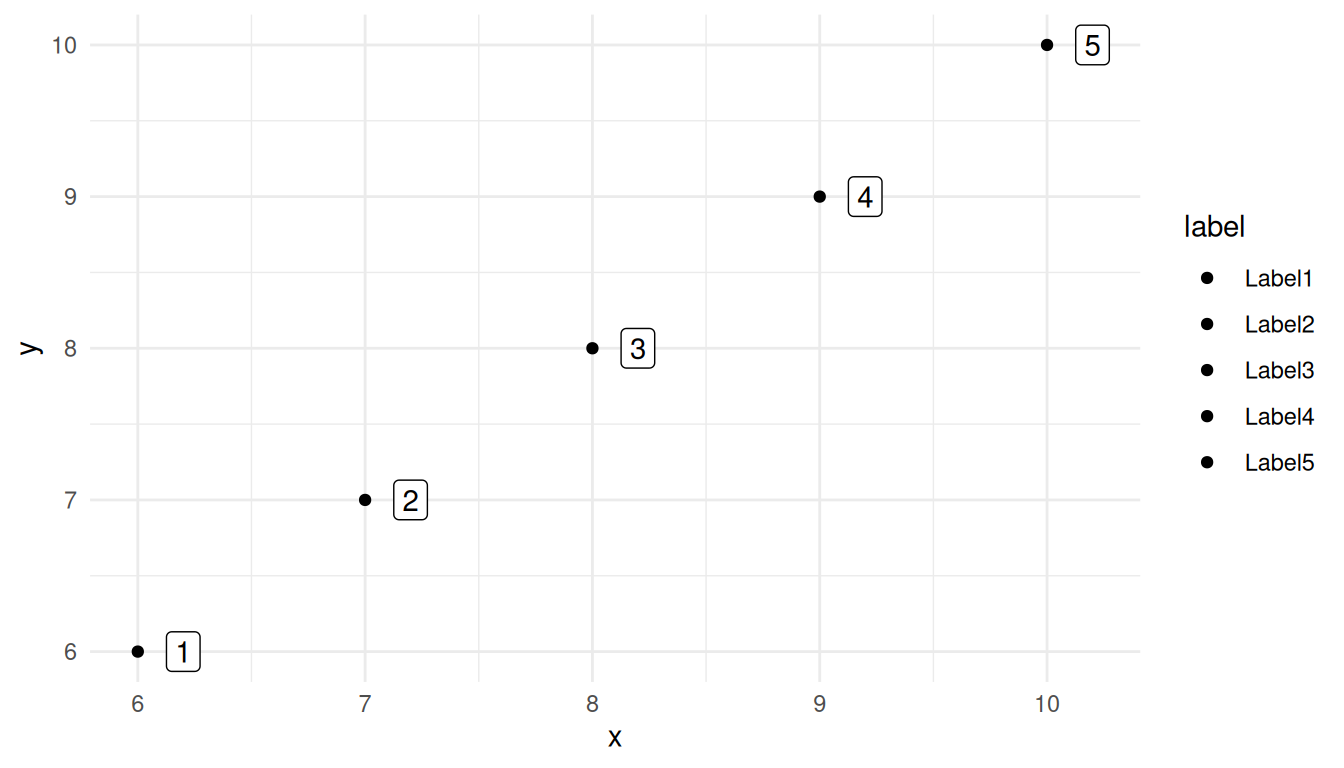
The workaround: numbers in the legend text
The accepted answer pastes the number into the description, maps the result to fill on an invisible layer, and hides the legend keys.
df$legend <- paste0(df$id, ": ", df$label)

ggplot(df, aes(x, y)) +
  geom_point(aes(fill = legend), alpha = 0) +
  geom_point() +
  geom_label(aes(label = id), nudge_x = 0.2) +
  scale_fill_discrete(name = "Index") +
  theme_minimal() +
  theme(legend.key.width = unit(0, "cm"))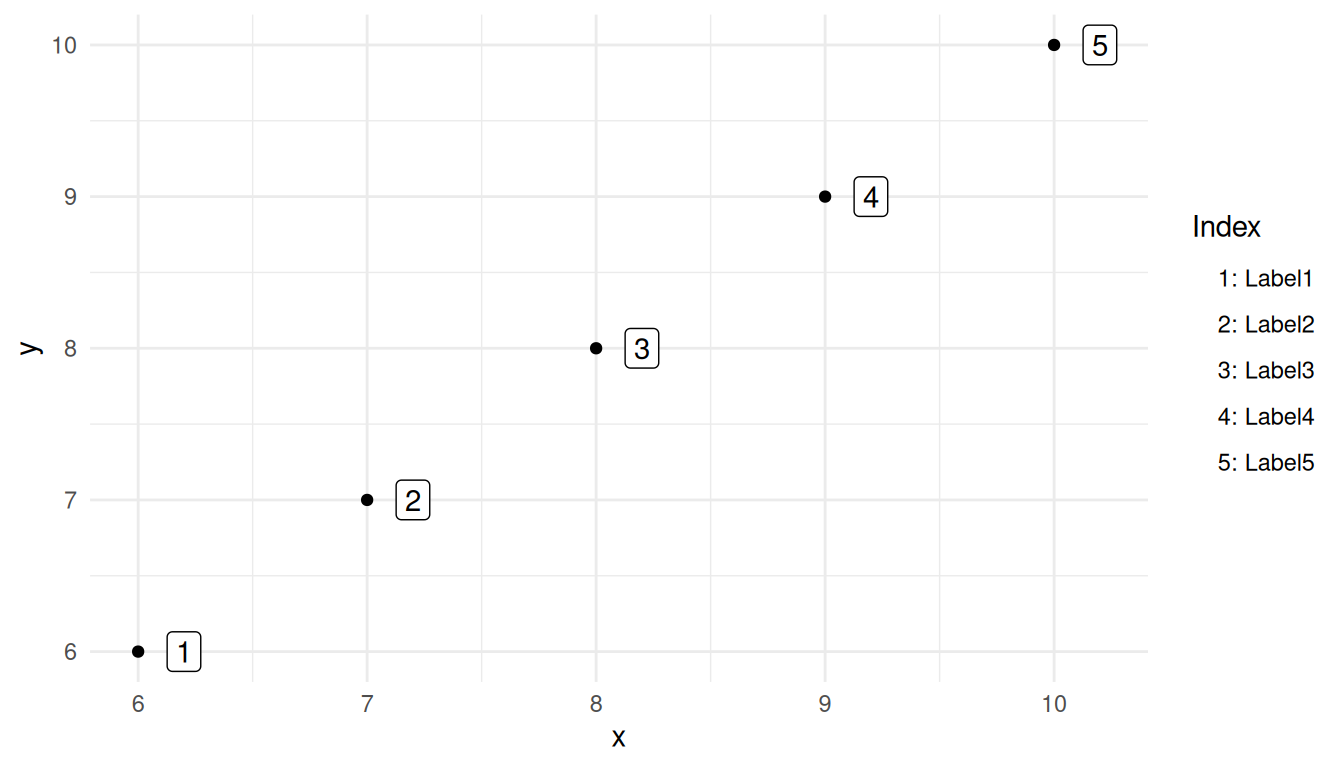
The result reads right, but the link between numbers and descriptions is held together by hand:
- The legend is text only. The markers on the plot and in the legend don’t match.
- The entries are sorted as text, so with ten or more points “10: …” comes before “2: …”. Keeping the number order needs a factor with explicit levels.
-
fillis used up by an invisible layer and can’t show another variable. - The numbers appear in two places,
idandlegend, which must be kept in sync.
What ggindex adds
ggindex adds an info aesthetic with its own scale. Its legend keys draw the marker with the label of each entry, so the numbers on the plot and in the legend come from the same mapping.
ggplot(df, aes(x, y, label = id, info = label)) +
  geom_focus() +
  scale_info_discrete("Index") +
  theme_minimal()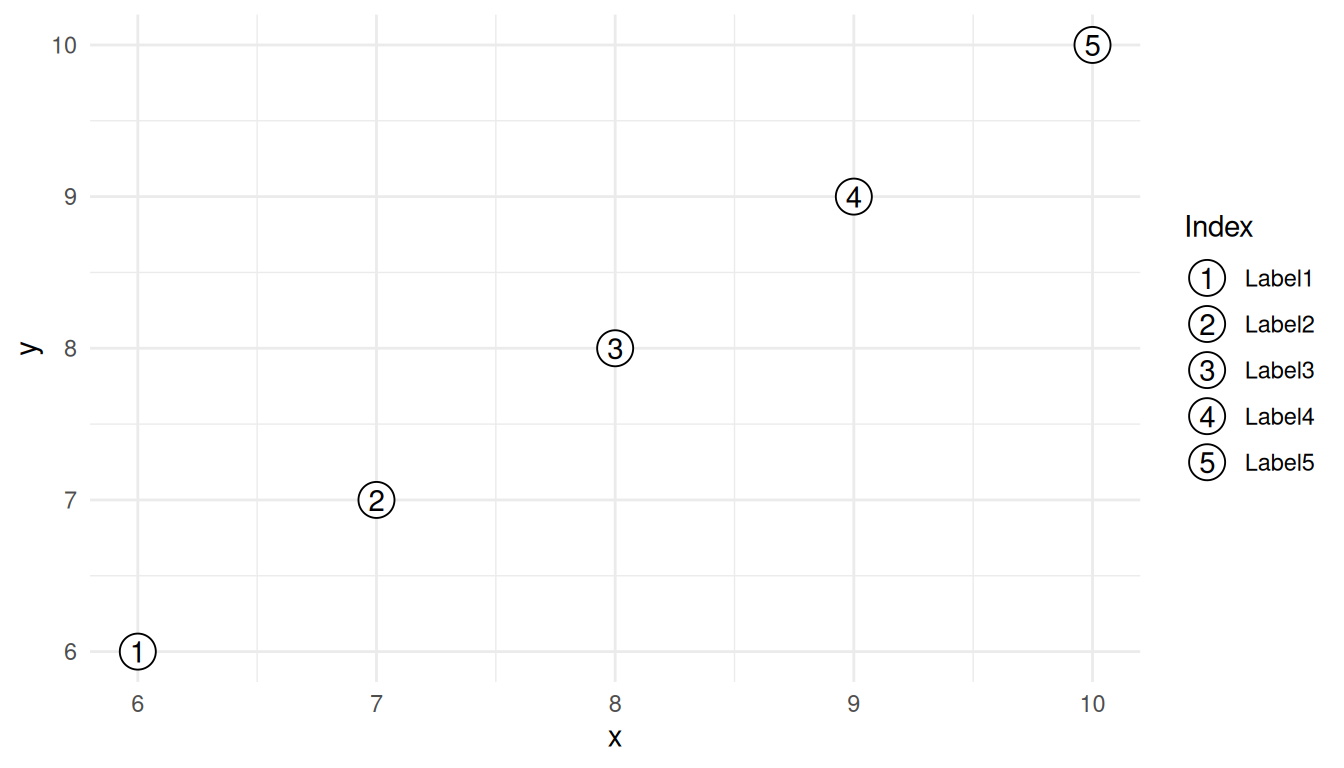
- Legend entries are sorted by
label, as numbers. -
colourandfillstyle the markers and stay free for other variables. - Without
label, theinfoentries are numbered for you. -
focusnumbers a subset of the points and leaves the rest to other layers. - Maps work the same way with
geom_sf_focus().
See Get started for these features, Styling numbered markers for colours, fonts, themes and facets, and Numbered markers on other plots for line charts, bar charts and distributions.